What was once tedious has become almost completely automatic.
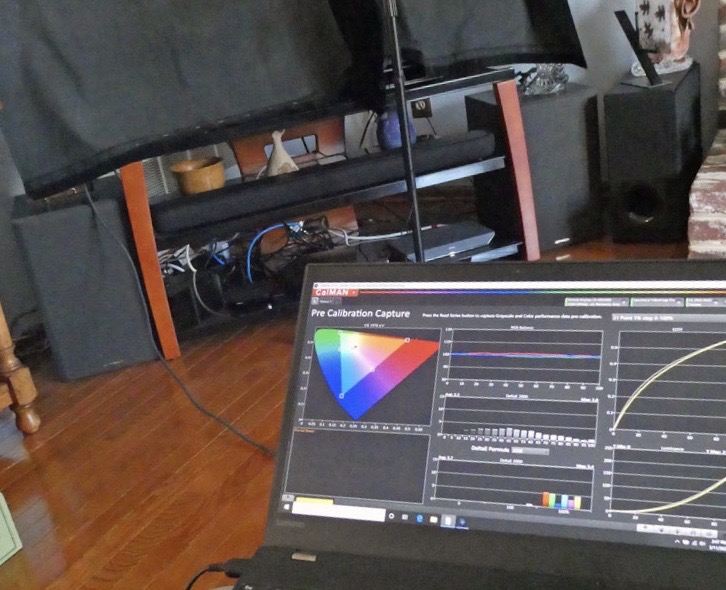
As I sit writing this column, my laptop is running the fina multi-point calibration of my new LG 55-inch ultra-HD OLED TV. The process is largely automated. It involves connecting the laptop and the TV through my home network, connecting a test pattern generator to the TV and connecting the pattern generator to a USB port on my laptop. Talk about artificial intelligence (AI)!
After I stepped through some initial setup information and selected the type of calibration I wanted, the software took over. It has already finished a standard-dynamic range (SDR) calibration, and it’s in the final stages of tuning up the TV for high-dynamic range (HDR) video. So, why, exactly, am I doing this?
Let’s go back in time. I originally got into display calibration more than 25 years ago as a result of doing numerous display product reviews for consumer and trade magazines. Over the years, I have set up, calibrated and reviewed hundreds of display products: LCD projection panels in the early 1990s, LCD and DLP projectors, plasma TVs and monitors, OLED monitors and even a few rear projection televisions. I even obtained one of the earlier Imaging Science Foundation (ISF) certification in 1995. And it made sense back then. At the turn of the century, you could easily spend $10,000 to $30,000 on a premium CRT video projector or plasma display, and you could justify hiring someone for $300 to $500 to calibrate it. There was a real benefit to the process at that time, as display manufacturers didn’t put a lot of thought into accurate grayscale and color reproduction.
The calibration tools that I used back then look positively rustic when compared to what’s available now. Back then, some test-pattern generators could be run automatically through software control to produce diagrams and data sets to track color temperature, luminance and red/green/blue histograms, along with a plot of the display’s color volume. However, I still had to go into the display’s menus and fiddle with RGB brightness and contrast controls, color-space selections and gamma adjustments, then run through the entire measurement process again. I spent many hours in darkened rooms, projecting into black-velvet screens to minimize reflections, or draping the display under measurement with folds of the same material.
Over time, the company that made my calibration software and the companion colorimeter exited the business, as did the company that made my test-pattern generators. There just wasn’t enough money in it, from their perspective. TV, monitor and projector prices have steadily declined, even as their out-of-the-box image quality has improved dramatically.
For display calibrators, it seems almost pointless to chase potential customers in today’s consumer-TV market. Today, you can buy a 65-inch ultra-HD television with basic HDR10 support for $500, and it’s pretty unlikely that you’d spend an additional $300 just to calibrate it. These large, inexpensive TVs have also put a big dent in home-theater projector sales, while also dinging the formerly strong calibration market for them.
Here’s the thing: As good as the display manufacturers are at producing images, there nevertheless is room for improvement—particularly with commercial displays. Think of reference and color-grading monitors, on-set monitors and displays, and tiled videowalls. Tiling is something that our industry does quite a bit of to achieve both higher resolution and larger screen sizes. (Of course, LED walls are all about tiling!) Matching individual displays within a tiled wall is a must. After all, just a slight bit of color shift from one tile to another will be noticeable even to the untrained eye; likewise, slight differences in luminance will be perceptible. Accordingly, I reached out to Portrait Displays to set up a test drive of the company’s latest AI-based display-calibration hardware and software. Mostly, I wanted to see how it compared to the complex, buggy and sometimes-inaccurate tools on which I relied years ago.
What I got was a temporary license to download and evaluate CalMAN Ultimate for Business (Windows 10) and a small, weatherproof case with a fist-sized colorimeter and a smartphone sized test-pattern generator. The software was light-years improved from my older programs. Notably, automated workflows were available for several existing brands of displays. In my case, there was already an automated workflow for LG OLED TVs that asked me to make a few connections, set a few parameters and then get the heck out of the way to let the software do its thing.
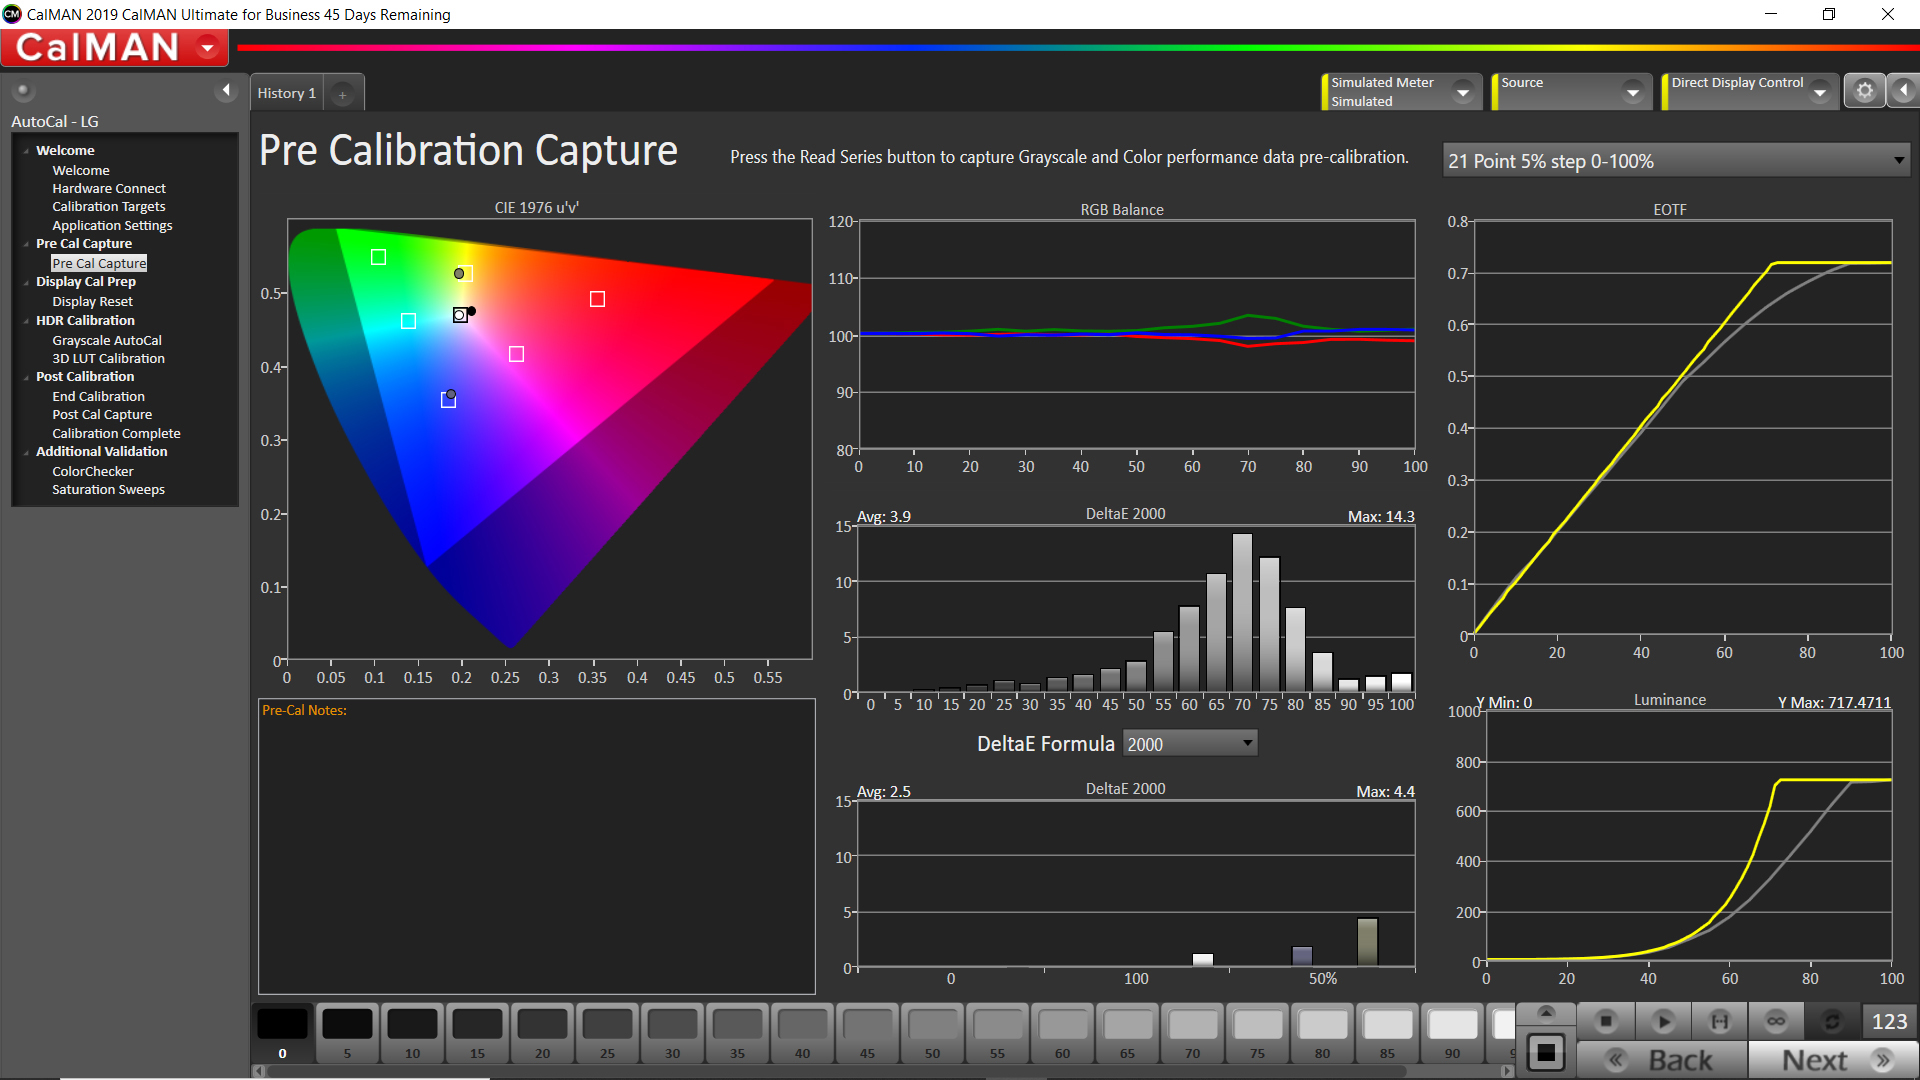
When I first set up the LG OLED TV, I used some “ballpark” settings from fellow reviewers to get close to optimum calibration. However, the “before” analysis histograms in both SDR and HDR modes showed there was room for improvement—in particular, around 50-percent luminance values. But I didn’t have to tweak a single thing! Thanks to an internet connection and a secure, personal identification number (PIN)-based login, the software readjusted settings as it took measurements. I didn’t have to do anything, except maybe go into the kitchen and make a sandwich.
It finished by producing a report that showed the display’s color volume; RGB tracking histograms; coordinates for red, green, blue, cyan, magenta and yellow; and the display’s electro-optical transfer function (EOTF)—also known as its gamma response—before and after calibration. As part of the process, the software also created a 3D look-up table (LUT) that took less than 10 minutes. (A more detailed characterization was available, but it would take several hours.)
For me, the most important parameter is how a display tracks a consistent color temperature across a full range of gray values, starting at full black and ending at 100-percent white. The RGB histogram shows that clearly, and, for manual calibration of displays, it gives you a good idea of which color brightness/contrast controls you have to tweak at different luminance levels.
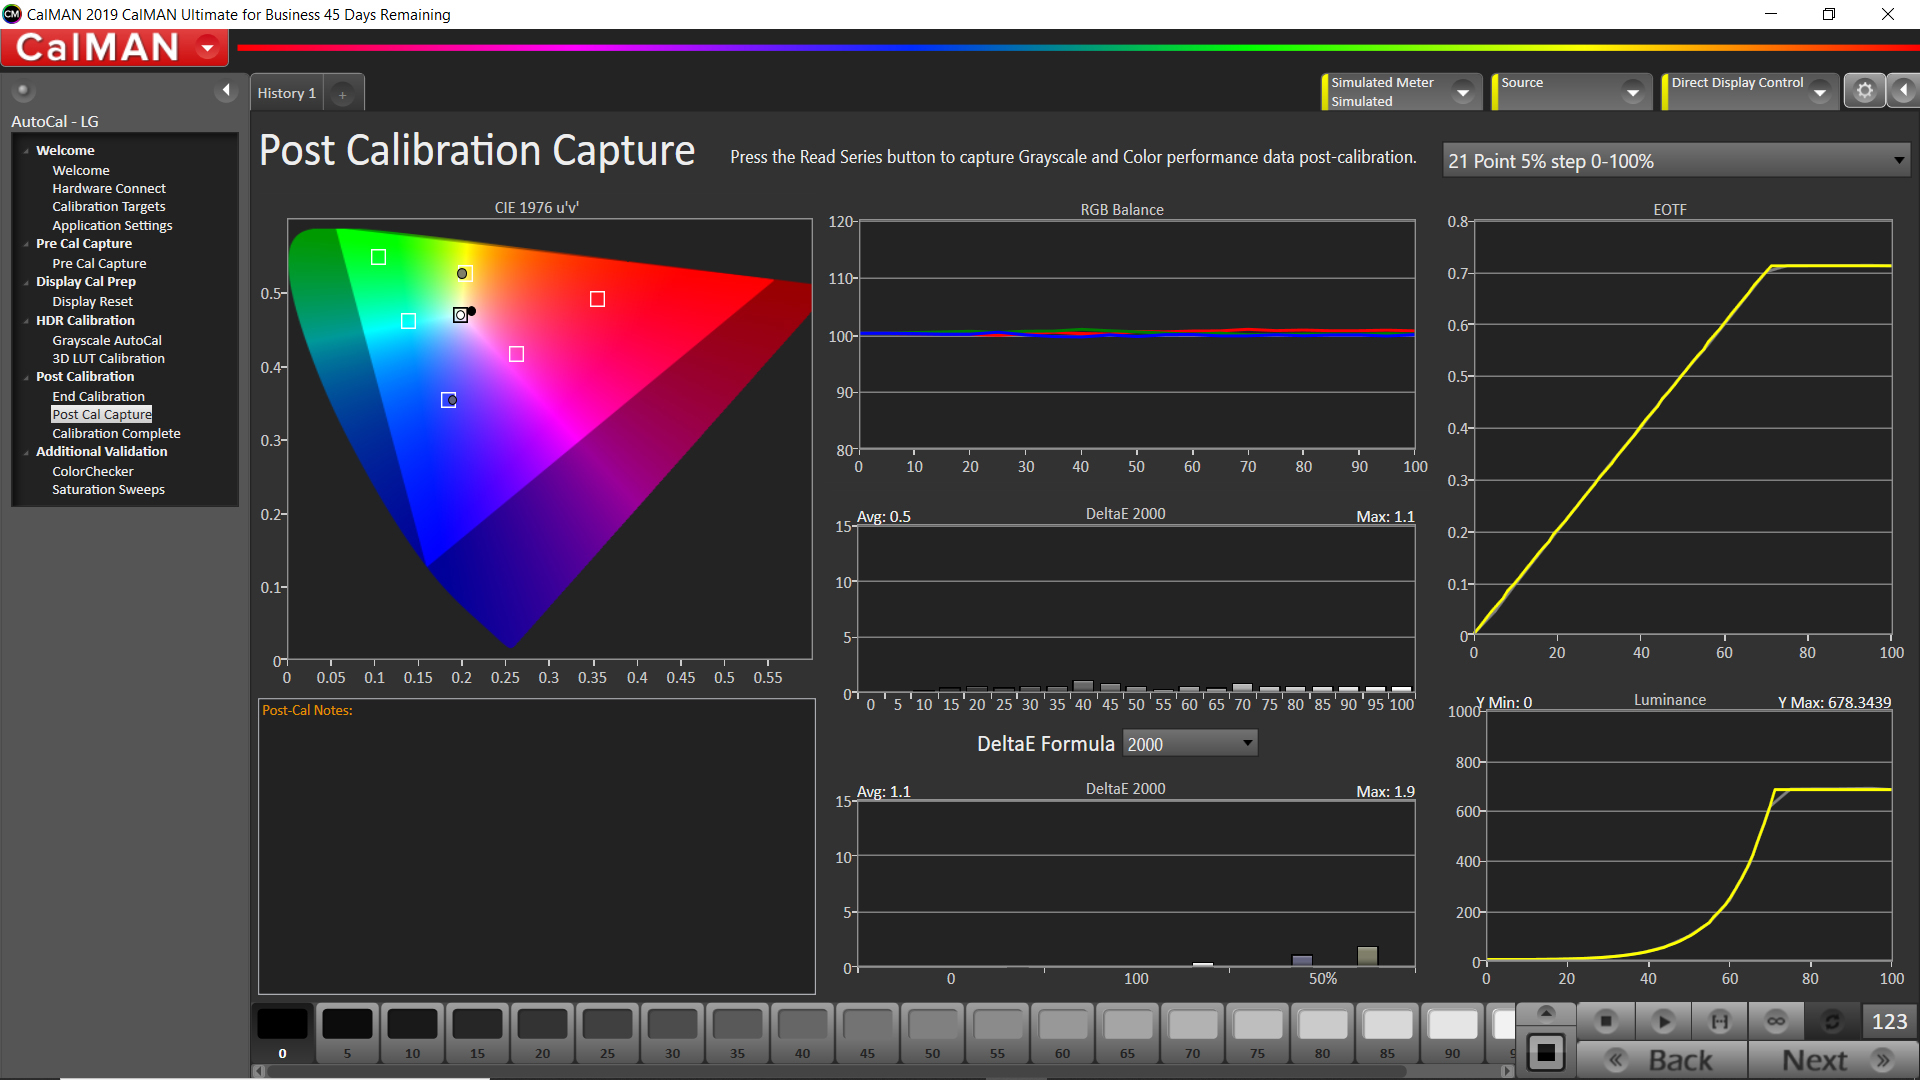
On some displays, you can also adjust multiple points along the desired gamma curve: red, green, blue and full white. That’s where the EOTF curve comes in handy. I also found that my OLED TV could produce a maximum small-area (10 percent) luminance value close to 700cd/m2 (205fL), which is indicated by where the EOTF curve flattens off in Figure 3. Typical diffuse white (full-screen) luminance clocks in around 160cd/m2 to 170cd/m2, or roughly 50fL.
In a practical application—for example, setting up a 3×3 videowall—I’d repeat the detailed calibration process on each individual panel after letting them warm up for an hour or so. Then, I’d go through and do spot checks once the wall was fully assembled. During the calibration process, I was prompted to set a peak white value. Therefore, that would have to be dialed in to every display in the wall before tweaking.
Is display calibration simpler now? From a software perspective, no. On that level, it’s far more detailed, as granular information about the display is measured and recorded. However, from the human operator’s perspective, it’s far easier than what I used to do because many of the steps have become automated.
The software comes with existing workflows for a variety of displays, including broadcast monitor, on-set monitor, and videowall and display wall, to make the job even easier; moreover, there are some brand-specific automated workflows that let the software make adjustments to the display during calibration. The entire workflow is saved as a file, and a report of the display’s performance is spit out as a PDF. Piece of cake!
This is just another example of how AI is becoming an intrinsic part of our daily lives. Display calibration requires sequenced, repeatable adjustments and measurements; accordingly, it’s an ideal candidate for software-driven automation via USB and network ports. Now, if you’ll excuse me, I want to go make a sandwich. That particular process hasn’t been automated…yet.
To read more video-centric content from Sound & Communications, click here.