Summary of Stadium STI Values [PDF]
In part one, I looked at the way that the additional sound absorption provided by an audience can reduce the reverberation time of a space and, consequently, improve the corresponding intelligibility of a sound system. Now, I am extending the discussion to cover the effects of audience noise and the combined effect of noise and absorption.
Dramatic Differences In Dynamic Range
Crowd and occupation noise varies enormously, depending on the situation and the venue. For example, the overall noise level in a shopping mall is generally reasonably static, gradually increasing as the occupancy increases and then decreasing as the occupancy reduces. Within that overall trend, there will be local perturbations caused by discrete events, such as children shouting, equipment crashing and banging, etc. Therefore, it is a reasonably simple matter to measure the background noise level and decide how loud the sound system must be to overcome it.
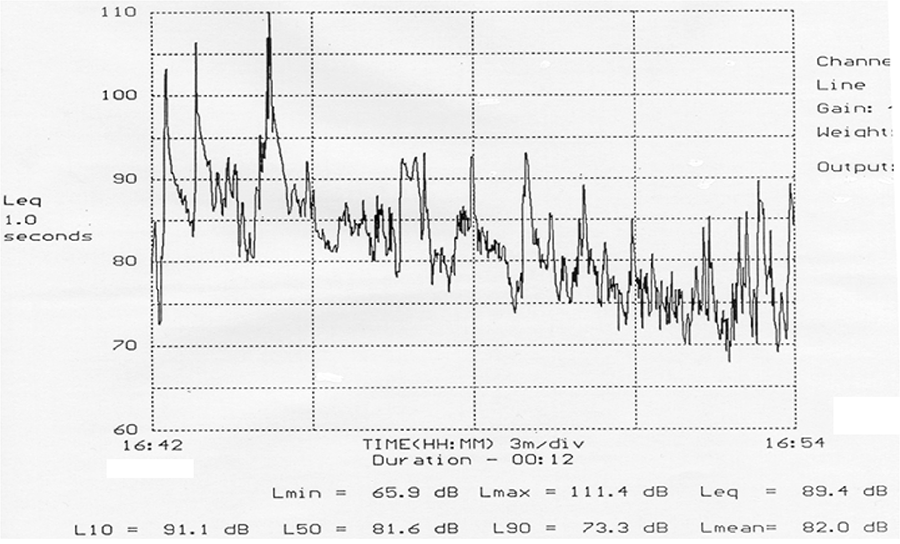
The noise profile and levels in a stadium with spectators watching a football or soccer game, however, are of a very different character, as they depend significantly on what is happening on the field. That, in turn, provokes a reaction and associated simultaneous noise output from the spectators. Figure 1 shows a typical profile for such an event. Here, a maximum level of 111dBA occurred, but the LAeq for the 12-minute period shown is 89dB.
Measuring “Average” SPL
Quantifying the sound pressure level (SPL) of such a variable noise is not straightforward, and a number of statistical parameters can be calculated. For example, there is the LA10—the sound level exceeded for 10 percent of the time, which is sometimes taken to be the “average maximum” level. In this case, it was 91dBA. The LAeq over a given time period is also a common method to quantify the noise. The noise level/time history profile plot is an extremely useful parameter, as it enables an idea to be obtained of when the venue sound system will be audible over the crowd noise. For example, let’s assume that the sound system can achieve and maintain a speech level of 95dBA. From an analysis of the plot in Figure 1, it can be seen that only the goal-score attempts and successes (the three large peaks to the left-hand side of the plot) will drown out the PA system; for the rest of the time, the system should be audible and potentially intelligible.
Considering Speech Intelligibility
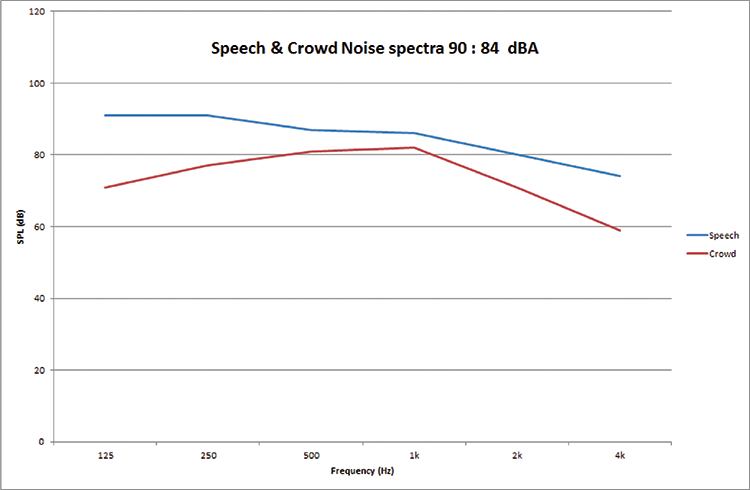
If, however, the PA system was nominally set to operate at, say, 90dBA, then it would be drowned out for more of the time, although it would still be adequately audible for the majority of the game. In practice, of course, it isn’t quite that simple, as the relative spectra of the speech signal and crowd noise also have to be taken into account. Figure 2 shows the relative frequency content of a 90dBA speech signal and general crowd noise of 84dBA. Here, a good signal-to-noise ratio is achieved at all frequencies—and particularly those most associated with intelligibility (1kHz, 2kHz and 4kHz).
However, there are two principal factors that affect speech intelligibility in such a venue, and the effects of the reverberation time (absorption), as well as the noise, must be taken into account. Those factors are nicely combined, however, in a Speech Transmission Index (STI) measurement or prediction. So, let’s see what happens when we apply both noise and audience absorption to a stadium situation, and what the ramifications of that might be. The exercise is based on a prediction because, in practice, it’s not possible to separate out and measure the individual components.
Measurements at the stadium in question showed the crowd noise level typically to be 93LAeq. So, a first guess would be, to overcome that noise level and be intelligible, it would require that the sound system be capable of achieving at least 103dBA to 108dBA. (Although a 10dBA signal-to-noise ratio is generally a good target, the spectrum of spectator noise is such that it tends to peak right in the intelligibility region at 1kHz and 2kHz; therefore, when looked at in more detail, a signal-to-noise margin of more than 10dBA might be required, particularly if there is significant reverberation.) Modeling the proposed sound system showed that it should be able to achieve 109dBA. So, it meets the above criteria.
Accounting For Absorption
Last month, I noted that the RT of the space was around 2.7 seconds when empty. Adding in the loudspeakers and a noise level of 93dBA indicates that the resultant average STI would be 0.46. However, the requirement is to achieve 0.50 STI. So, a potential fail? No…not necessarily. The noise level only reaches 93LAeq when the space is occupied. So, we must also account for the additional absorption that the spectators introduce, not merely their noise. I calculated that the reverberation time, when fully occupied, would reduce from 2.7 seconds down to around 1.8 seconds at mid frequencies. With no noise, that
hypothetically increased the average STI to a stunning 0.72. However, you can’t add in just the additional absorption, as the accompanying noise must also be taken into account. That resulted in the average STI (STIPA, in this case) being 0.54—a pass. The 0.50 STI target was achieved with some room to spare…probably just about enough to account for the prediction tolerances.
The ramifications of this exercise are worthy of further consideration, as it shows you cannot take an unoccupied STI measurement of a reverberant space and simply add in the expected noise level to obtain a valid STI result. The effect of audience absorption also must be taken into account. However, that can only be accounted for by a complex calculation based on computer modeling the space or venue—not something that would normally form part of a measurement survey.
Furthermore, measuring the system at its maximum operating level will also further reduce the resultant STI, because STI is level dependent—a point often forgotten in many predictions and indirect STI measurements. Although a true value would be obtained if the system were to be run at maximum in the empty venue, that might not be what happens in practice. In other words, the venue should be tested at the level at which it would normally operate.
What’s clear is that it isn’t a simple matter to test an unoccupied, reverberant space and then readily extrapolate what would happen in its occupied state. Anyone know the number for “Rentacrowd”?
To read more from Sound & Communications, click here.