Most people, I think, would assert that obtaining even sound coverage is a good design goal to aim for—or, at least, a good place to start. But what do we mean by this? How even is even? And even when the sound level is even, does that mean the intelligibility coverage will be even? Furthermore, which is more important—an even sound pressure level (SPL) or even intelligibility (e.g., STI/STIPA)? What do we even mean when we say the SPL is even? Do we mean the direct sound SPL or the total sound? Furthermore, if we specify the direct sound to be even, how do we measure that? In the majority of indoor systems, it will be buried below the reflected and reverberant sound, so an ordinary sound level meter or RTA is not going to measure it. Sorry…I know it’s early in the year for such obtuse thinking, but these questions are fundamental to what we do in the sound design and installation world—or, at least, they should be!
On one hand, an even sound level should mean that listeners would hear the sound system at approximately the same level. That would seem like a good idea. However, I would contend that intelligibility is more important; after all, if a system isn’t intelligible, what’s the point of having it? Unless you are working in an anechoic chamber or outside, there is always going to be some reflected and potentially reverberant sound kicking about, just waiting to be excited. So, is the aim to get the listeners within the coverage angle of a loudspeaker, or is there more to it than that? Well, you can bet on it being more complicated, but, to start with, we need to ask a question: “What is the coverage angle of a loudspeaker?”
Most people, when they think about the coverage angle, take it to be the angle between the minus 6dB points. In other words, it’s the included angle between the angular locations where the SPL has dropped by 6dB relative to the on-axis position. To visualize this, it’s probably easiest to consider the coverage of a simple ceiling-cone loudspeaker, which would typically have a coverage angle of around 90 to 120 degrees. However, the coverage angle will be frequency dependent, generally being greater at low frequencies and narrowing at high frequencies. If it is a two-way device—that is, if it has a tweeter or high-frequency horn—the high frequency narrowing will be overcome and it might become wider and more consistent or, indeed, might initially become wider and then start to collapse again. The point is that you, as a system designer, need to know what the loudspeaker is doing and is potentially able to cover.
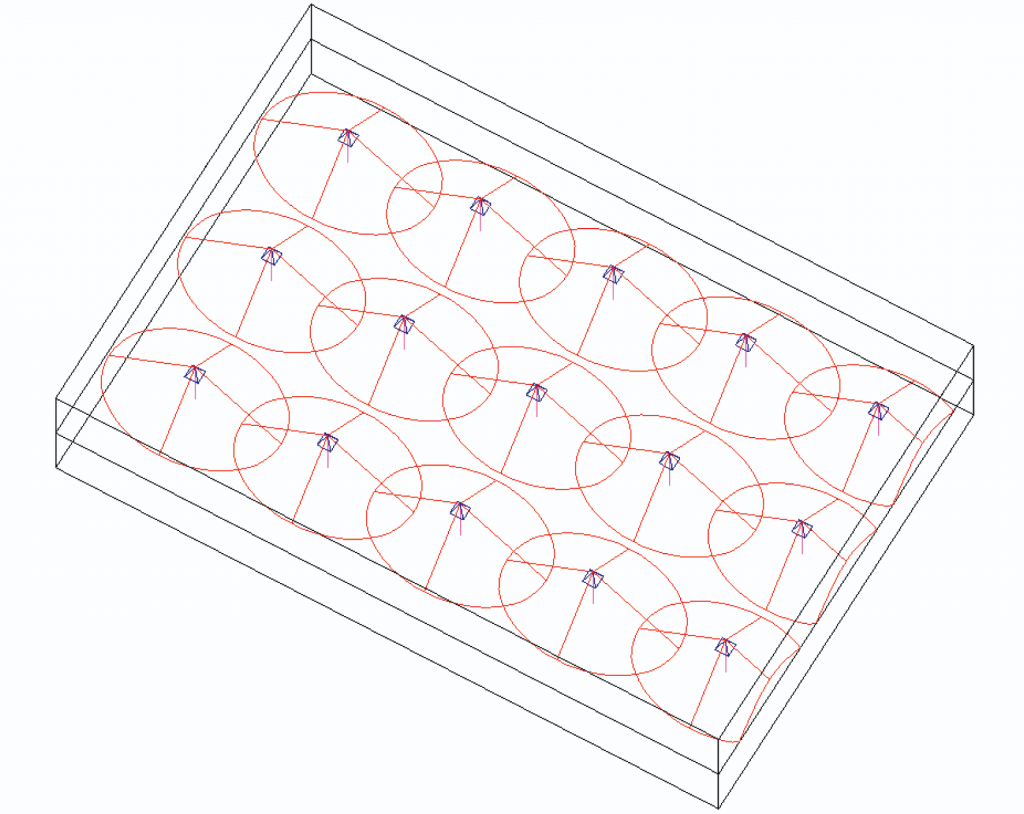
Figure 1, for example, shows a typical ceiling loudspeaker arrangement where the loudspeakers are located with a nominal “edge to edge” overlap pattern. As can be seen, this is an efficient way to cover a space, and it should lead to reasonably even coverage. The objective here is to minimize the patches of gray that do not lie within the loudspeaker coverage cones. However, although this approach might be appropriate for a conference system, meeting room, etc, it would be overkill for a paging system in a typical office area.
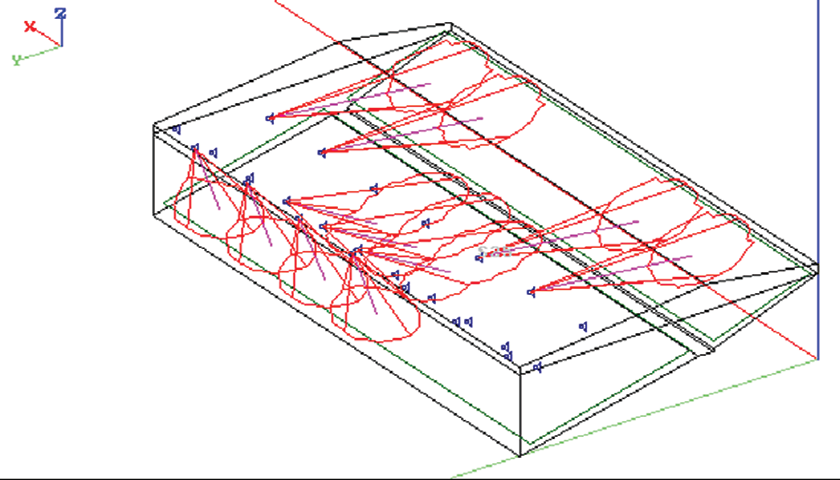
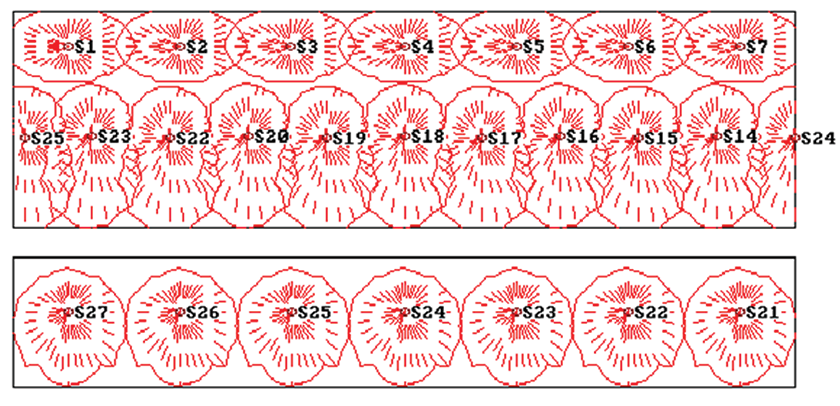
The same basic idea with regard to coverage can be applied to other situations, such as the seating area of a soccer stadium, as shown in Figure 2. Here, for clarity, I am only showing some of the loudspeakers activated. They have been spaced and located so that the projected coverage contours just touch. Figure 3 shows a plan view of the potential coverage.
However, the projected 6dB contours do not mean that everyone inside the contour will receive a sound level within 6dB.
Consider, for example, the first or second row of loudspeakers shown in Figure 2. Due to the angle of projection, the sound from the rear of the loudspeaker—albeit 6dB down, just as it is at the front—has to travel farther to reach its target. That extra distance actually introduces a further loss, which, in this case, is almost an additional 3dB. “So what?” you might ask. “3dB is almost imperceptible, so what’s the problem?” you might wonder. Well, in terms of SPL alone, yes, 3dB is not a major change. However, in terms of potential intelligibility, 3dB, when considered as a difference in signal-to-noise ratio or direct-to-reverberant ratio, can be very significant. It can quite literally be the difference between speech being reasonably intelligible and it being unintelligible!
Moreover, in this case, the 3dB is in addition to the loss of 6dB, which, by definition, we were working with when designing with the 6dB coverage angle. Now, the observant among you will immediately ask, “If 3dB can produce such a significant change, then why on earth are we using 6dB contours? Where did they come from?” Good questions! Let’s address them.
Well, for starters, no one says that you have to design with the 6dB down angle—in fact, I regularly use the 3dB contour in many of my designs—but it’s somewhat open to speculation as regards where the 6dB down definition/arrangement originated. I’ve asked many people in the industry for their take on this, and, essentially, the replies fall into two groups: (a) 6dB down was chosen because, for coherent sources, such as loudspeakers, the output from adjacent loudspeakers, when 6dB down, will combine and add back to a difference of 0dB. (Two identical noise sources remember [non-coherent] will add to give 3dB addition.) (b) 6dB is a reasonable variation for a system to have. Digging around, however, I found a comment from the great Don Davis. To paraphrase, it says: From a single overhead point source, if you aim at the last row, and can get the source high enough so that the -6dB angle hits halfway to the front, you get [about] the same SPL at the front and back seats.
So, this approach turns an acoustical calculation into basic geometry, which, in the days before computer modeling, was a useful aid to speaker aiming. Although this effect would be true for the case in mind, I have to wonder what this has to do with ceiling speaker coverage and the practice of edge-to-edge pattern spacing or other, closer packing. Furthermore, as I mentioned earlier, the 6dB coverage angle is frequency dependent—so, to what frequency does this rule apply? Maybe that’s a question to answer next month, when I will look at some other aspects of frequency and coverage.